DETERMINING THE FORECAST
- Our machine learning model analyzes the expansion figures of the last 3 years and projects developments over the next 12 months. In this way we can predict the development of future months with an accuracy of around 95%. For details about our accuracy, see Chapter 6 in the INSIGHTS section.
- For forecasting, we use time series analysis with moving averages and exponential smoothing. This is a special case of regression, a simple but robust machine learning algorithm. Our model calculates forecasts at the city/district level and adds these to the forecast at the state and federal level.
- Factors such as expansion plans by operators, government support measures or new legislation are not taken into account for the forecast. Taking these factors into account could make the forecast more accurate, but on the other hand it could also lead to incorrect forecasts if, for example, plans are not implemented or the impact of external factors does not correspond to the predicted extent.
- Charging stations are often reported retrospectively, sometimes even more than a year after the actual installation date. The forecast model takes such late reports into account and automatically adapts the forecast model and predictions to the new data.
OTHER AREAS OF APPLICATION
I-WUNDER is developing a universal geoinformation system (GIS) that can be used for a wide variety of applications to display and analyze regional relationships. This framework forms the basis of our e-mobility application, but can also be used for other use cases, for example for:
Traffic information
Visualization of traffic metrics
Citizen information systems
As part of smart city projects
Sales and Service
Controlling business activities of companies
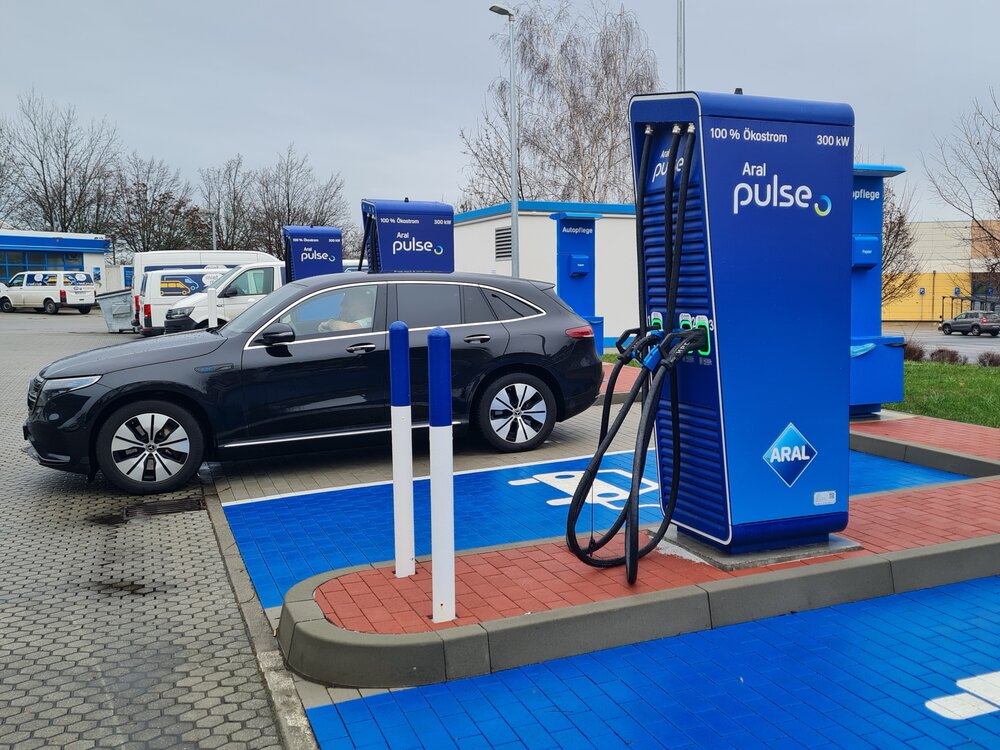
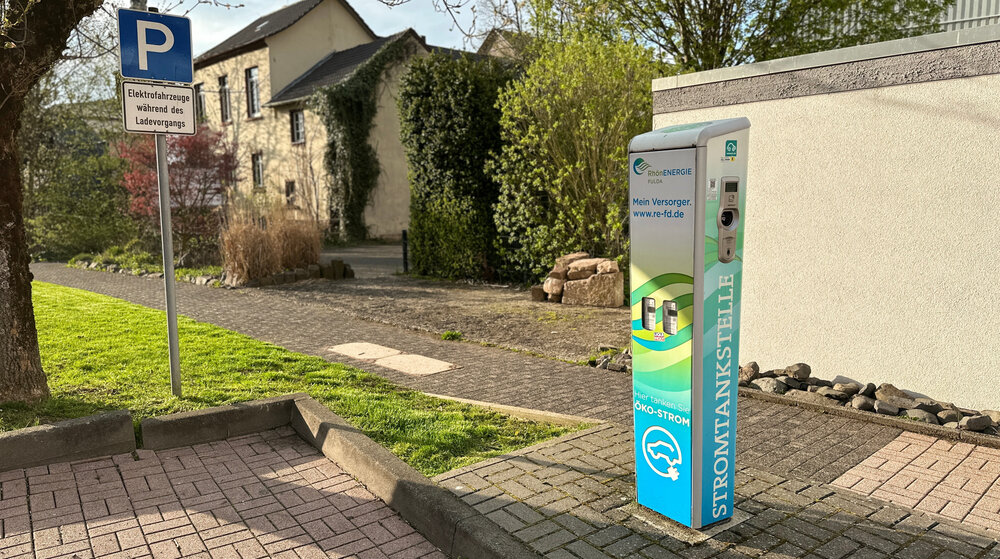
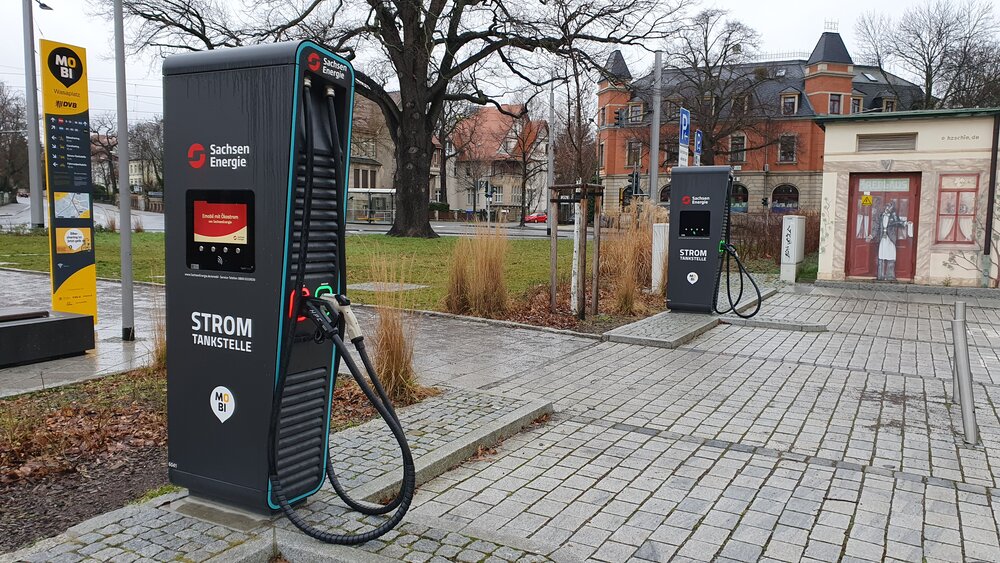
In the present scenario, the data from all publicly registered charging stations of the Federal Network Agency is used. In this way, meaningful key figures are determined at the regional level of federal states and districts and a forecast is calculated for a forecast horizon of one year. The application visualizes the current actual values and at the same time shows a forecast for future development in the regions.
TECHNICAL SOLUTION
The tool uses modern open source technologies and freely available map data and can therefore be used quickly and cost-effectively in companies or municipal institutions. The advantages lie in the interactive display of geodata and geo-based key figures on the web as well as the drill-down into different regional structures. The data for map display is prepared using a web hosting framework and made available on the Internet.
DATABASE
PostgreSQL
FRAMEWORK
Flask
Jinja2
Mapbox
Bootstrap
jQuery
DEVELOPMENT
Python
JavaScript
HTML
CSS
Restful API
Git
Docker
OUTLOOK
The expansion of the charging infrastructure has firmly established itself as an important component of the change towards e-mobility. This development is supported by guidelines for phasing out the production of combustion vehicles as well as the announcement of climate neutrality initiatives by companies and communities.
It remains to be seen how the relationship between private charging stations in the form of wallboxes, which benefit from cheap electricity generation for self-consumption, and the range of public charging stations will develop. Current trends are being set by promoting charging stations in companies and businesses.
Further developments in the next few years will include:
- Optimization of the charging network, e.g. through bidirectional use of the existing battery storage to cushion peaks in demand or supply in electricity production
- Use of hydrogen as an additional energy source, assuming the availability of climate-neutral solar-hydrogen systems
For us, e-mobility is one of the most exciting topics of the future and we will continue to support and accompany it with our developments and analyses. Please feel free to discuss your experiences and ideas with us at e-mobility[at]i-wunder.com.
Data sources
- Charging station map, Federal Network Agency, CC BY 4.0
- Vehicle inventory by district, Federal Motor Transport Authority, January 1, 2022
- Regional keys used: Official municipality key (AGS), 5 digits
- Study “How many charging points will Germany need in 2030?”, National Charging Infrastructure Control Center, November 19, 2020
The cars in the Trier-Saarburg district are registered together with the cars in the city of Trier. The key figures for “attractiveness” and “needs in 2030” for these two districts are therefore based on statistical estimates. The estimation procedure uses the weighted average number of cars per population of the three surrounding districts. From this, the number of cars for Trier-Saarburg is approximately determined and adjusted for the city of Trier.